Oil futures rose this morning after lower than expected crude inventories in the United States, and despite an increase in coronavirus cases lightly obfuscating a positive demand outlook. At 3.45 am GMT front-month Brent futures were up 48 cents (1.2%), to $41.75 a barrel. WTI was up 54 cents (1.4%), at $39.81 a barrel. According to data from the American Petroleum Institute (API), crude stocks dropped by 8.2 million barrels to 537 million barrels, against analysts’ forecasts for a draw of 710,000 barrels. Gasoline inventories were significantly down as well, while distillates stocks rose. More definitive data from the US Energy Information Administration is due for release later in the day to confirm these estimates. Supporting prices was also at a 20 year low in June output from OPEC+ members, at 22.62 million bpd. Despite record levels of compliance at 107%, it is likely that such compliance will slip again in July. ConocoPhillips will start increasing production in its North American oilfields in July, after curtailing 460,000 boe/d in June. A Reuters poll suggests that oil prices will consolidate at around $40 a barrel this year, with a potential recovery in the fourth quarter. Meanwhile, rising coronavirus total is now more than 10 million with more than half a million casualties. As the return of lockdown is looming in certain states and US citizens are banned from travelling to Europe, bullish market sentiment is dampened, capping any strong recovery in crude prices in the short term.
MARKETS NEWS:
* Shell Warns of Record Writedown as Virus Curbs Oil Demand
* Conoco to Bring Back Curtailed Oil Output in Response to Rally
* Venezuelan Crude Output Falls for Sixth Month, Deepening Crisis
* China’s Largest Oilfield Plans to Increase Output 10% by 2025
* Canadian Oil Discount Tops $10/Bbl as Surmont Output Rises
* Libya’s Eastern Messla Field Resumes Oil Output at 10K B/D
* Petrobras Says Buzios Oil Field Posted Record Output on June 27
* API Reports U.S. Crude Stockpiles Fell 8.16M Bbl Last Week
* U.S. April Crude Oil Output Fell 5.3% M/M to 12.06M B/D: EIA
* Oil Has Best Quarter in 30 Years After Historic Crash: Chart
OTHER NEWS:
* Asia Gas-to-Plastic Ventures Bleed as U.S. Shale Output Sputters
* From Fear in Wuhan to Oil Crash: Six Months in Emerging Markets
* Oil Search Cuts Staff, Sees Lower Production Costs
PHYSICAL CRUDE NEWS:
* ASIA: Saudis Seen Raising Arab Light OSP for August Sales
* LATAM: Aruba Seeks to Reopen Refinery; Buzios Record
* US/CANADA: Conoco to Bring Back Curtailed Oil Output
* NSEA: Litasco Bids Ekofisk, Forties Up; Gullfaks Loadings
* MED: OMV Bids CPC Blend Higher; Urals at Record Premium
* WAF: Nigeria’s Unsold Backlog Persists; Rabi Blend Exports
OIL PRODUCT NEWS:
* U.S.: Michigan Wants Line 5 Shutdown to Last Days
* EUROPE: ICE Gasoil Contango Shrinks; EasyJet Hedges
* ASIA: Road Fuel Demand to Peak; Sinochem Unit Sells
ECONOMIC EVENTS: (Times are London)
* 3:30pm: EIA weekly report on U.S. oil inventories; TOPLive blog begins 3:20pm
* Bloomberg survey on OPEC’s June crude production
* Bulk of Bloomberg monthly tanker-tracking compilations for June published throughout the day
* Genscape weekly ARA crude inventory report
ANALYST COLUMNS:
* Jet Fuel Demand Won’t Recover to 2019 Levels Next Year: IATA
OTHER FINANCIAL MARKETS:
* Asian Stocks See Muted Start to Third Quarter: Markets Wrap
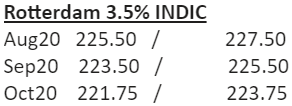
Rotterdam 3.5% INDIC
Aug20 225.50 / 227.50
Sep20 223.50 / 225.50
Oct20 221.75 / 223.75
Nov20 221.75 / 223.75
Dec20 222.75 / 224.75
Jan21 224.75 / 226.75
Q4-20 222.00 / 224.00
Q1-21 226.00 / 228.00
Q2-21 229.75 / 231.75
Q3-21 231.75 / 234.75
CAL21 228.75 / 234.75
Singapore 380 INDIC
Aug20 238.75 / 240.75
Sep20 239.50 / 241.50
Oct20 240.50 / 242.50
Nov20 241.50 / 243.50
Dec20 243.00 / 245.00
Jan21 244.75 / 246.75
Q4-20 241.50 / 243.50
Q1-21 245.50 / 247.50
Q2-21 248.25 / 250.25
Q3-21 250.50 / 253.50
CAL21 248.25 / 254.25
Rott VLSFO 0.5% INDIC
Aug20 296.75 / 301.75
Sep20 300.75 / 305.75
Oct20 304.25 / 309.25
Nov20 307.50 / 312.50
Dec20 310.50 / 315.50
Jan21 314.25 / 319.25
Q4-20 307.50 / 312.50
Q1-21 317.25 / 322.25
Q2-21 324.50 / 330.50
Q3-21 330.50 / 338.50
CAL21 324.75 / 332.75
Singapore VLSFO 0.5% INDIC
Aug20 310.00 / 315.00
Sep20 316.25 / 321.25
Oct20 322.25 / 327.25
Nov20 327.50 / 332.50
Dec20 331.75 / 336.75
Jan21 335.50 / 340.50
Q4-20 327.00 / 332.00
Q1-21 338.25 / 343.25
Q2-21 346.00 / 352.00
Q3-21 351.75 / 359.75
CAL21 347.25 / 355.25
Sing 10ppm GO INDIC
Aug20 48.32 / 48.46
Sep20 48.37 / 48.57
Oct20 48.66 / 48.86
Nov20 48.94 / 49.14
Dec20 49.22 / 49.42
Jan21 49.56 / 49.76
Q4-20 48.90 / 49.20
Q1-21 49.91 / 50.21
Q2-21 51.05 / 51.35
Q3-21 52.08 / 52.38
CAL21 51.37 / 51.77
ICE Gasoil 10ppm INDIC
Aug20 365.54 / 367.54
Sep20 369.23 / 371.23
Oct20 372.07 / 374.07
Nov20 373.37 / 375.37
Dec20 375.63 / 377.63
Jan21 378.81 / 380.81
Q4-20 373.70 / 375.70
Q1-21 380.69 / 382.69
Q2-21 389.19 / 391.19
Q3-21 396.72 / 398.72
CAL21 391.59 / 393.59
